Edit Project Network
Overview
Our project network management system provides you with a powerful and flexible toolset to manage any project's configuration settings with associated systems, objects, and general settings. With this functionality, you can easily add or remove associated systems and define the objects for which you require data integration. This control level allows you to customize your projects according to your specific needs and ensure seamless data integration across all associated systems and objects.
Navigation: Home > Projects > Edit > Network
Network View Mode Settings
Project network supports the following view:
- Interaction View
- Dataflow View
By default, the Interaction View will appear if you have not set your preferences. To set the default view mode, refer to the Network Editor Settings article. If you have set your default view as Interaction view in the Network Editor Settings, you land on the Select Entity pop-up. If you have set the default view to the Dataflow view, the pop-up will be skipped, and you will land directly on the Dataflow view tab.
Once you are on the network screen, you will either land on the Interaction View or the Dataflow View, depending on your settings. Both the Interaction View and the Dataflow View are available on separate tabs of the network screen. You can switch between the tabs to change the view.
Start Editing Mode
- To edit a project's network, you have three options:
- First, click the Edit icon in the project card's context menu.
- Second, you can click on the Entities section on the project card.
- Alternatively, you can select the Edit option in the drop-down on the Project Details screen, then click the Network band to start editing the project network.

Please note that the default network view screen setting is defined under 'My Settings'. If you have already configured your default view, you will be taken to the Interaction View or Dataflow View. If you have not set it yet, the Interaction View will be shown by default.
- If you choose either option '1' or option '3', you will be directed to the edit screen, where you need to click on the Network band.
- If you choose option '2', you will be directed to the Select Entity pop-up, where you need to select the entity for which you want to view the network.
Interaction View
- This section describes the information and functions of the interaction view.
- Click on the Entity section on the project card.
- A Select Entity pop-up will appear.
Select Entity
- When you click on the Network band in the Edit screen, the Select Entity pop-up will appear, displaying the list of entities. In the network view, entities are referred to as systems, automation, or artificial channels.
- If you have already assigned entities to your project network, you can see a list of all entities in the pop-up. This list includes both the systems and automation added to the project and those connected to the project network.
- Additionally, you can use the Search or Type filter to find the desired entity. Type the entity's name in the search field to get the desired result. You can also use the type field to aggregate entities by type, such as automation, channel, and system.
- A legend icon appears in the top right corner of the screen. When you click the icon, a list of the legends used on the screen will be shown.
- Click on the entity that you want to view on the Interaction view.
Legends
This section describes the legends shown on the screen. When you hover over any entity, the name of the entity will appear in a tooltip:
- Shapes:
- Each entity is designed with a different shape. The shapes are as follows:
- Automation is presented in a square shape.
- Channels are presented in a hexagonal shape.
- Systems are presented in a circular shape.
- Status:
- Alert: Displays the color used for entities with critical issues that require immediate user intervention.
- Inactive: Displays the inactive color for the entity marked as inactive by the user.
- Normal: It displays the color indicating that the entity is working properly without any issues.
- Not Connected: This displays the color used for entities added to the project but not connected to the network.
- Warning: This displays a warning color on the entity that has issues and needs attention.
- Icons:
- Maintained in another project: If the system is marked as Maintained in another project, it is also used in that project.
- Private System: If a system displays a Private System icon, it is exclusively for dedicated users. For example, if a user has a system controlled by their private credentials, no other user can alter the system's settings, as this is deemed private.
Network Diagram
- After selecting an entity in the Select Entity pop-up, the screen opens the Interaction view tab, displaying the network diagram for the selected entity.
- The selected entity will be placed in the center of the diagram, and the connected entities will be arranged around it.
- To view an entity's details, click any entity in the diagram; it will be highlighted with a check icon, and its details will be displayed in the network tab.
- You can view the network diagram of any entity by double-clicking on the entity. Once you double-click any entity in the network diagram, the clicked entity will be moved to the center of the diagram, and connected entities will be created around it.
Legends
- You will notice a legend icon in the top-right corner of your screen.
- A list of the color legends used on the screen will be displayed when you click the icon.
- Additionally, the icons and shapes used on the screen will also be explained.
- These legends provide a convenient way to locate and distinguish between various color-marked entities, making it easier to keep track of them all.
Show Data Flow Direction
- A toggle button is located in the top-right corner of the screen before the legend icon.
- This button lets you view the flow connection between the systems.
- If you enable the toggle button, the flow direction icons will appear on each system's network line.
Action Area
The following action icons are provided in the action area of the screen:
- Show Entity:
- Upon clicking the icon, the Entity tab will be opened next to the Network tab in the context area of the screen.
- Please note that if another tab is already open, the Entity tab will open next to it.
- The details of the Entity tab are explained in its respective section.
- Filter:
- Upon clicking the filter icon, the Filter tab will be opened.
- Please note that if another tab is already open, the Filter tab will open next to it.
- The details of the Filter tab are explained in its respective section.
- Help:
- Upon clicking the Help icon, the Help tab will be opened.
- The Help tab will provide relevant help articles.
- Add button:
- An Add button drop-down is provided. When you click the Add button, an Add Wizard will be initiated, allowing you to add the desired entity to your project.
- The drop-down provides the Connect option:
- Connect:
- With this option, you can link the added entities together.
- Upon clicking Connect, the Connect Wizard will open, allowing you to link previously added entities to one another.
Network Tab
- The Network tab is located on the right side of the screen and will open by default.
- By default, the tab displays a card for the selected entity, showing the entity's details and indicating its status with different colors. The status colors can be viewed under the legend icon.
- If you click outside the network diagram, a list of entities in the diagram will be displayed in the tab.
- Below the detail card, a list of action menus will appear, tailored to the entity selection.
- A separate band represents each action item, and you can click on any band to perform the corresponding action.
- Clicking on any action band will direct you to the relevant screens.
Entity Tab
- Upon clicking the Show Entity icon in the action area, the Entity tab opens in the screen's context area.
- Please note that if another tab is already open, the Entity tab will open next to it.
- The Entity tab will display a complete list of the entities of the selected project.
- The entities are categorized into the following sections:
- Channels
- Systems
- The selected entity will be highlighted on the band with a tick icon.
- Upon selecting any other entity, the band gets selected, and you will be directed to the Network tab with its details.
- Double-clicking any entity will perform the following actions:
- The entity band will be selected with a checkmark icon.
- You will be directed to the Network tab, displaying its details.
- The network diagram will be constructed with the chosen entity positioned at the center.
Filter Tab
- Upon clicking the filter icon in the action area, the filter tab will open in the screen's context area.
- Please note that if another tab is already open, the filter tab will open next to it.
- The following fields will be provided on the filter:
- Entity:
- The drop-down field lists the available entities for the selected project.
- When you open the filter for the first time, the entity present in the center of the network diagram will be auto-filled.
- However, you can choose any entity from the drop-down list.
- Please note that if you double-click on any entity in the network diagram, that entity will be centered, and the name of the clicked entity will be displayed in the field.
- Connected Entity:
- The drop-down field will display the list of connected entities from the current network diagram.
- If you click on the network line between the connected entities, the field will auto-populate with the entity connected to the center entity.
- Note: If both the entity and connected entity fields are filled in the drop-downs, and the user switches to Data Flow View, only these two entities will be displayed in the data flow.
- Object:
- The Object field must be provided.
- The drop-down must provide the list of all objects.
- Status:
- The Status field must provide the following options:
- Active
- Inactive
- All (both inactive and active)
- Trace:
- The Trace field must provide the following options:
- On
- Off
- All (both Off and On)
Load and View Network Diagram
- To load the network diagram of any entity, double-click on it.
- The clicked entity will be brought into the center, and the connected entities will be built around it.
- This can be achieved from two locations:
- Option 1 - From Network Diagram:
- Double-click any entity in the network diagram.
After clicking the entity, it will be brought to the center. - Option 2 - From Entity Tab:
- Double-click any of the entities listed on the Entity tab.
Edit Connected System
- Click on the connected system in the network diagram.
- After you click the system, the supported action items will be listed on the Network tab, along with the system details at the top.
- For the connected system, the Edit System action item is supported.
- To edit the system, click on the Edit System button.
- Refer to the Edit System article for steps to edit the system.
Edit Not Connected System
- Open the Entity tab, and then expand the System section.
- Bring the not-connected system into the center of the diagram by double-clicking on the band.
- After you click on the system, the supported action items will be listed on the Network tab, along with the system details at the top of the Network tab.
- For the not-connected system, the following action item is supported:
- Edit System:
- To edit the system, click on the Edit System button.
- Refer to the Edit System article to know the steps to edit the system.
- Remove From Network
- To remove the system from the current project, click on the Remove From Network button.
- Refer to the Remove Entity article to know the steps to edit the system.
Modify Connection
- Click on the connection line between the connected systems.
- After clicking on the connection line, a list of supported actions appears on the Network tab, along with the connection details.
- Initialize:
- This action allows you to initialize and synchronize the data between the connected systems.
- To initialize the data between the systems, click on the Initialize button.
- Refer to the "Initialize" article for steps to synchronize the data.
- Please complete the object configurations and connection settings before initializing the data.
- Edit Configuration:
- This action enables you to set up and activate the directions of object and data flow between connected systems.
- To initialize the data between the systems, click on the Initialize button.
- See the "Initialize" article for steps to synchronize the data.
- Edit Connection:
- This action enables you to set up the connection settings, ensuring seamless data integration between connected systems.
- To edit the connection, click on the Edit Connection button.
- Refer to the "Edit Connection" article to learn how to configure the connection settings.
- Disconnect:
- This option enables you to disconnect the connected entity from the project network.
- Click the Disconnect button to disconnect the selected system from the network. To disconnect the selected entity, you first need to disconnect the entities that subscribe to its data. If the entity is linked to multiple entities, a list of the connected entities will be shown on the screen.
- Refer to the Disconnect article for the disconnection steps.
Dataflow View
- This section describes the information and functions of the Dataflow View.
- If you are on the Interaction view, click on the Dataflow View tab.
Please note that if you are accessing the project edit menu and you have set the default view as Dataflow view, you will be directed to the Dataflow view. Please note that if you have not set a default view, you will land on the Interaction View, and you must manually click the Dataflow View tab to view the data in tree view.
- The Dataflow View tab becomes active.
- In the Dataflow View, you can see all connected entities in tree view mode.
- In the tree view, you can observe the connections between entities, including systems, channels, objects, and components.
- A separate node represents each entity in the tree view. The entity and component nodes can expand or collapse the tree at their respective levels. An accordion is provided on the node itself to collapse or expand the tree.
Legends
- You will notice a legend icon in the top-right corner of your screen.
- A list of the color legends used on the screen will be displayed when you click the icon.
- Additionally, the icons and shapes used on the screen will also be explained.
- These legends provide a convenient way to locate and distinguish between various color-marked entities, making it easier to keep track of them all.
Toolbar
- You will notice a toolbar in the top-right corner of the working area.
- The toolbar provides several options for working in the dataflow view.
- The following actions are supported:
- Reset:
- This icon lets you reset the zoom-in and zoom-out functions to their default settings.
- Zoom in:
- This icon lets you zoom in on the tree view.
- Zoom out:
- This icon lets you zoom out in the tree view.
- Collapse and Expand:
- This icon allows you to collapse the node at the asset level.
- Click the icon to collapse the tree view and reveal all the asset nodes. Once the nodes are collapsed, click again to expand them.
- Maximize:
- The icon lets you maximize the screen, enlarging your working area. When you click the icon, the tree view will display in full-screen mode.
- You can return to the standard view by clicking the minimize icon while in full-view mode.
Asset/Channel View
- A drop-down is provided to switch between the Entity and Channel views.
- By default, the Entity View will be selected.
- To switch to the channel view, click on the drop-down and select the Channel View option.
Edit Mode
- The Edit Mode allows you to activate or deactivate the trace for the component.
- To mark the component as active or inactive, you need to enable Edit Mode first. Similarly, if you want to enable tracing for any component, first enable Edit mode.
- Enable the Edit Mode toggle switch.
- The edit mode is now active.
- You may now enable Trace for any component. Additionally, you can designate the component as Active or Inactive.
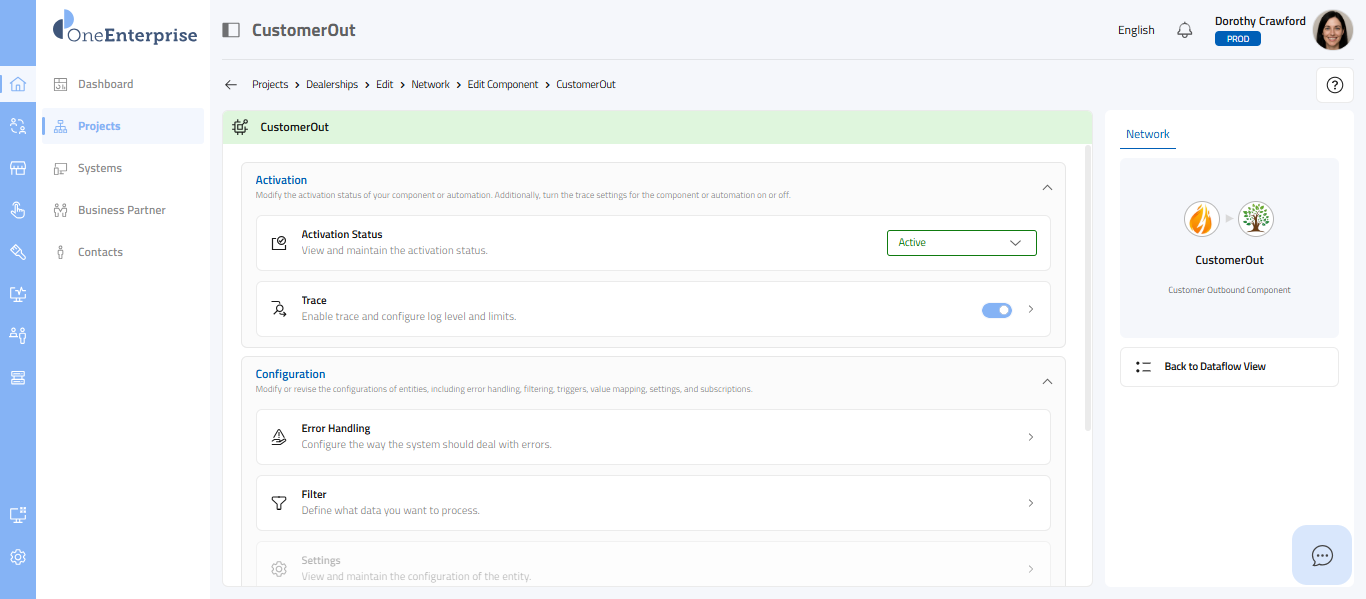
Activate Component
- To activate the component status, select the Active option from the drop-down.
- The selected component gets activated and displays the status as Active.
Deactivate Component
- To deactivate the component status, select the Inactive option from the drop-down.
- Once you select the Inactive option from the drop-down, a confirmation pop-up will appear.
- The pop-up will list the entities subscribing to this component. If you mark the selected component as Inactive, the entities that have subscribed to this component will stop receiving data for it.
- Click Yes to deactivate the component.
- Click No to cancel deactivation.
Enable/Disable Trace
- To enable or disable trace, click on the switch.
- If you enable or disable the trace, a confirmation pop-up will appear.
Full Screen View
- To maximize the screen to full-screen mode, click on the maximize icon.
- To return to normal mode, click the minimize icon on the screen.
Action Area
The following action icons are provided in the action area of the screen:
- Show Entity:
- Upon clicking the icon, the Entity tab will be opened next to the Network tab in the context area of the screen.
- Please note that if another tab is already open, the Entity tab will open next to it.
- The details of the Entity tab are explained in its respective section.
- Filter:
- Upon clicking the filter icon, the Filter tab will be opened.
- Please note that if another tab is already open, the Filter tab will open next to it.
- The details of the Filter tab are explained in its respective section.
- Help:
- Upon clicking the Help icon, the Help tab will be opened.
- The Help tab will provide relevant help articles.
- Add button:
- An Add button drop-down is provided. When you click the Add button, an Add Wizard will be initiated, allowing you to add the desired entity to your project.
- The drop-down provides the Connect option:
- Connect:
- With this option, you can link the added entities together.
- Upon clicking Connect, the Connect Wizard will open, allowing you to link previously added entities to one another.
Network Tab
- The Network tab is located on the right side of the screen and will open by default.
- By default, the tab displays the list of entities in the tree view.
- If you select any entity in the tree view, a card for that entity appears, showing its details, indicated by different colors based on its status. The status colors can be viewed in the legend icon.
- Below the detail card, a list of action menus will appear, tailored to the entity selection.
- A separate band represents each action item, and you can click on any band to perform the corresponding action.
- Clicking on any action band will direct you to the relevant screens.
Entity Tab
- Upon clicking the Show Entity icon in the action area, the Entity tab opens in the screen's context area.
- Please note that if another tab is already open, the Entity tab will open next to it.
- The Entity tab will display a complete list of the entities of the selected project.
- The entities are categorized into the following sections:
- Channels
- Systems
- To view the list of entities, click the section to expand it.
Filter Tab
- Upon clicking the filter icon in the action area, the filter tab will open in the screen's context area.
- Please note that if another tab is already open, the filter tab will open next to it.
- The following fields will be provided on the filter:
- Entity:
- The drop-down field lists the available entities for the selected project.
- Select any entity from the drop-down.
- A tree view will be presented for the selected entity.
- Object:
- The drop-down field will list all OE objects.
- Choose an appropriate object from the drop-down to get the result.
- For example, if you have chosen Business Partner from the drop-down. The tree view will display all components that subscribe to the business partner object.
Action and Trigger
- The Dataflow View lets you add triggers and actions to objects or components in the tree view.
- Note that triggers can only be placed in a channel view and apply to the Inbound component. Similarly, actions can be dropped into the entity view and added to Outbound components.
- Expand the section to see the list of supported actions and triggers.
Apply Action

Please note that Edit Mode needs to be enabled before dropping the action or trigger into the tree view.
- To apply the action to the outbound component, expand the Entity section and click the Action button you want to configure.
- As soon as you click the Action button, the tree view will begin highlighting possible drop points. You can drag and drop the action onto any of these drop points. Once you are sure about the drop point, drag the Action band and drop it into the selected object.
- There might be multiple drop points in the tree view; if so, a counter will display the count. You can use navigation arrows to view the desired drop point.
- If you haven't enabled Edit Mode before dropping the action into the tree view, a confirmation pop-up will appear to prompt you to enable it.
- Click Yes on the pop-up. This enables the Edit Mode and allows the process to continue.
- If you click No, the pop-up will close, and the process will terminate.
- After dropping the Action into the tree view, the pairing process will begin, and a pop-up will appear to show the progress.
- Once the pairing is complete, a pop-up will display a success message and a confirmation to configure the component's settings.
- If you wish to configure the component's settings, click the Yes button in the pop-up. After clicking the Yes button, you will be taken to the component's edit screen.
- Click on the No button if you wish to configure the settings later.
- If you have clicked the Yes button in the pop-up to configure the settings now, the following screen will appear, where you can configure all the components' settings.
- Refer to the Edit Component articles for steps to configure the component.
Edit System From Dataflow View
- Click on the system node in the tree view.
- After you click the system node, the supported action items will be listed on the Network tab, along with the system details at the top of that tab.
- For the connected system, the following action item is supported:
- Edit System
- To edit the system, click on the Edit System button.
- Refer to the Edit System article for steps to edit the system.
Modify Component
- Click on the Component node in the tree view.
- After clicking on the connection line, a list of supported actions appears on the Network tab, along with the connection details.
- Initialize:
- This action allows you to initialize and synchronize the component data between the connected systems.
- Click on the Initialize button.
- Refer to the "Initialize" article for steps to synchronize the data.
- Please complete the object configurations and connection settings before initializing the data.
- Edit Component:
- This action enables you to set up the component settings, ensuring seamless data integration between connected systems.
- To edit the component, click on the Edit Component button.
- Refer to the Edit Component articles for steps to configure the component.
- Disconnect:
- This option enables you to disconnect the component from the published object.
- Click the Disconnect button. To disconnect the selected component, you first need to disconnect the entities that subscribe to it. A list of the connected entities that are subscribing to the chosen component will be shown on the screen.
- Refer to the Disconnect article for the disconnection steps.
Related Articles
Edit Project Network
Overview The Edit Project Network feature lets you update the systems and connections linked to a project. Use it to modify network configurations, adjust integrations, or update connection details. Navigation: Home > Projects > Edit > Network Step 1 ...Project Network Overview
Overview This section describes the Project Network — the workspace where you add, connect, and manage entities within a project. After adding entities to the network, you can establish connections between them and modify the objects those ...Edit Project Details
Overview This section describes how to edit the details of an existing project, including the project name and description. Navigation: Home > Projects > Edit > Details Step 1 – Start Editing Mode You have two options to open the Edit Project screen: ...Edit Project Logo
Overview The Edit Project Logo feature lets you upload, replace, or remove the logo for an existing project. Navigation: Home > Projects > Edit > Logo Step 1 – Start Editing Mode You have two options to open the Edit Project screen: Option 1: Select ...Edit Project Team Members
Overview This section describes how to add and remove team members from an existing project. Navigation: Home > Projects > Edit Step 1 – Start Editing Mode You have two options to open the Edit Project screen: Option 1: Select the Edit icon from the ...